Main Body
3. Differential Thermal Analysis:
 Learning Objectives
After going through this Part, you should be able to:
- Explain the principle and working of a differential thermal analyser.
- Draw and interpret DTA thermogram.
- Compare and contrast TG and DTA results.
- Explain the applications of DTA and simultaneous TG-DTA analysis
When a molecule undergoes a physical or chemical transition, heat is either absorbed or liberated. Two thermal methods, DTA and DSC are particularly useful for investigating these physical and chemical changes.
3.1 Principle and Instrumentation:
In DTA, the difference in temperature between the sample and an inert reference (∆T) is measured as the sample and the reference are heated or cooled in a controlled manner.
TS = temperature of sample
TR = temperature of reference which is thermally stable
Please go through the Chemlibre link to understand the principle and working of DTA.
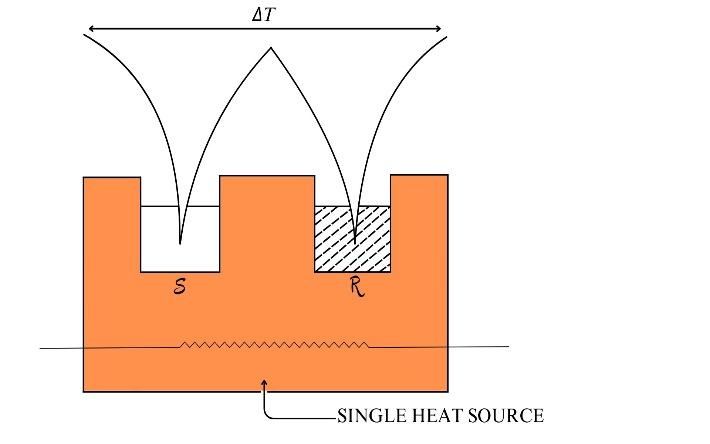
Instrumentation and working: A typical DTA set up is shown in the figure given below.

Figure 3.1a. DTA set up
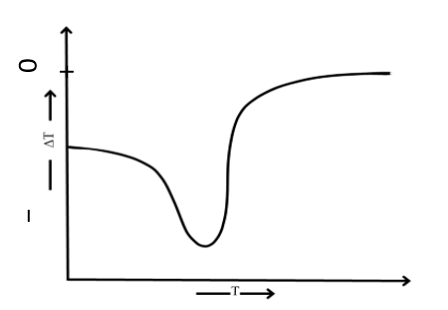
In differential thermal analysis (DTA), the difference in temperature between the sample and a thermally inert reference material is measured as a function of temperature (usually the sample temperature). Any transition that the sample undergoes results in the liberation or absorption of energy by the sample with a corresponding deviation of its temperature from that of the reference. A plot of the differential temperature, ΔT, versus the programmed temperature, T, indicates the transition temperature(s) and whether the transition is exothermic or endothermic. DTA and thermogravimetric analyses (measurement of the change in weight as a function of temperature) are often run simultaneously on a single sample.
3.2 DTA curve and its interpretation
∆T = Ts – TR
Ts= temperature of sample
TR = temperature of reference which is thermally stable
A typical DTA curve is represented below
 Figure 3.2a. DTA curve
 Brain Teaser:
Can you suggest why we adopt ∆T > 0 for exothermic and ∆T < 0 for endothermic transition?
 Activity 3A: The following figure represents thermal investigation. Fill in the blanks by choosing the correct option. (James & Tonge, 2008)

The record shown is that of a_________________ experiment since the_________ plot ∆T which is a ______________temperature. The ___________direction of the peak indicates that a __________________reaction has occurred. This in turn implies that the corresponding _________________ change ∆H must have been ____________ ie the value of enthalpy ________________the thermal effect was ____________ than its value _____________.This means that the sample ____________ heat during the reaction. Furthermore, there is evidence of a change _______________in the temperature is increased beyond the thermal transition. This is shown by the ___________of the just beyond the end.
Answers: Select from the following list
[upward/downward, free energy/heat capacity, greater/less, DTG/DTA, base-line/background, derivative/differential, took in/gave out, negative/positive, enthalpy/entropy, before/after/during, exothermic/endothermic/isothermal, abscissa/ordinate, distortion/displacement.]
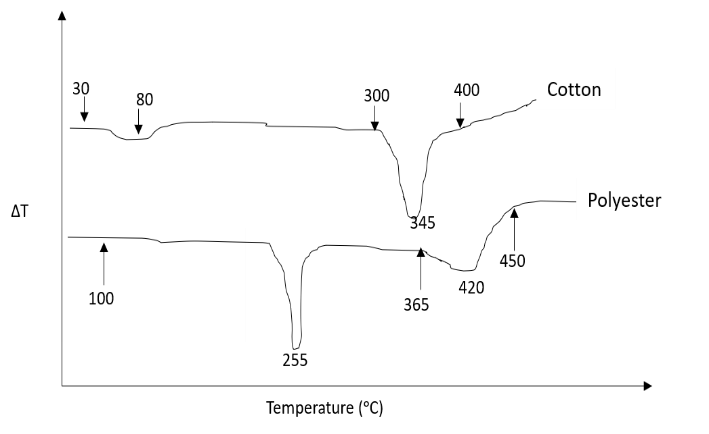
 Activity 3B: (James & Tonge, 2008)
During the Falklands campaign in 1982 many naval personnel suffered serious
burns. In 1985 the Admiralty decreed that all men on active service in Navy
should be issued cotton uniforms instead of polyester ones which had been
issued in 1982. Does the thermal data suggest a reason for the decision?
Justify your answer?

Fig. DTA curves for cotton and polyester -50 mg heated in pure nitrogen at 5ᵒC min-1
3.3 Comparison with TGA
|
|
TGA |
DTA |
|
1 |
It measures change (loss or gain) in weight as the sample is subjected to controlled heating program |
It is a technique in which the difference in temperature between the sample and an inert reference material, is measured as a function of temperature |
|
2 |
It will detect only those physical and chemical transitions which are accompanied by change in weight. |
It can detect all physical and chemical transitions. |
|
3 |
This does not require an inert reference. |
This requires an inert reference material. |
|
4 |
It is a quantitative method |
It is a semi-quantitative method. |
|
5 |
This technique is generally used to study decomposition reactions. |
This technique is used to study phase transitions |
3.4 Simultaneous TGA/DTA analysis??? Pending
3.5 Applications???Pending
 3.6 Game and quiz: pending

